Power BI Training

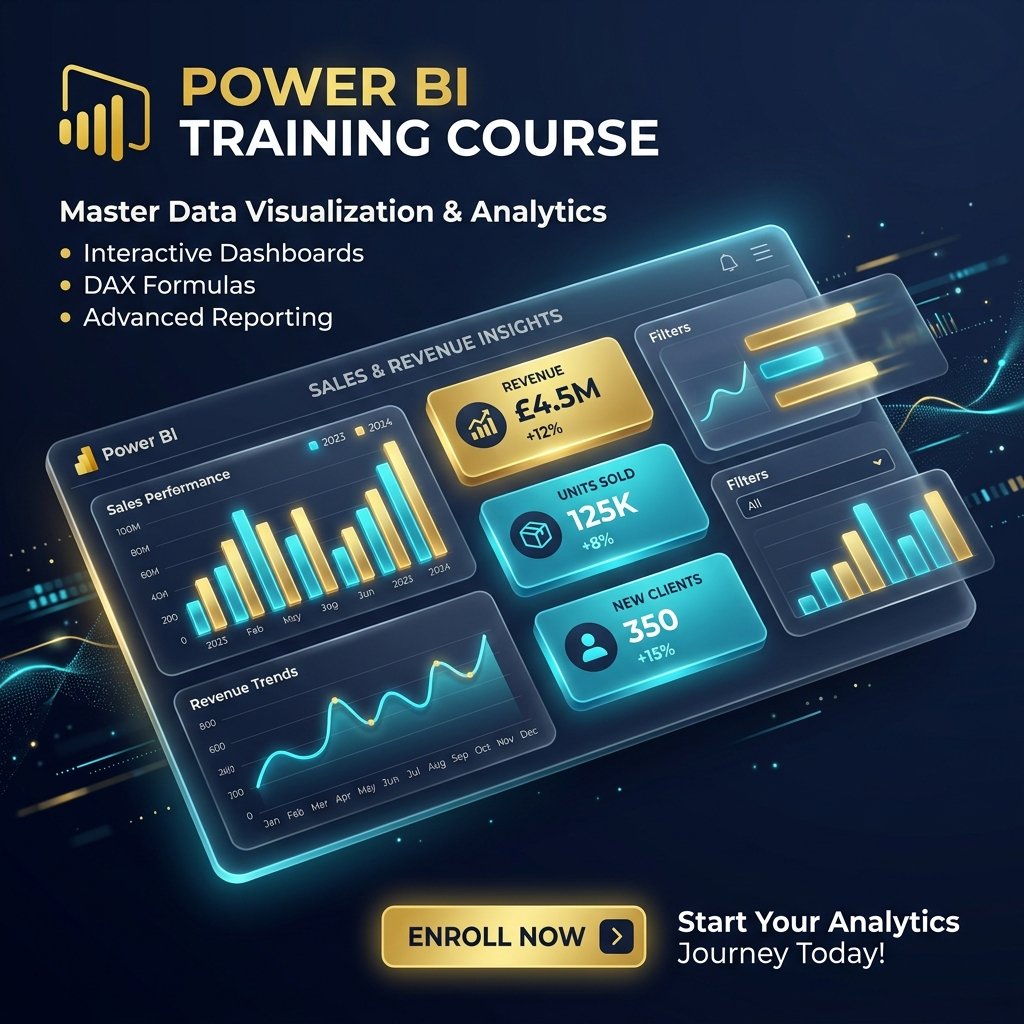
The #1 Business Intelligence tool in Indian enterprises. Build interactive dashboards, write DAX measures, and publish reports that decision-makers actually use — all in 6 weeks.

6 Weeks 🖥 Online & Offline 🎓 Certificate Included 💼 100% Placement Assistance
Get Details on WhatsApp

What you'll master

Power BI Desktop — Full Interface & Workflow
Data Modelling — Relationships & Star Schema
DAX — Measures, Calculated Columns, KPIs
Power Query — Data Transformation & Cleaning
Interactive Dashboards & Reports
Publishing to Power BI Service
🕐
6 Weeks
Course Duration
👨‍💻
Online & Offline
Learning Mode
🏆
₹4 – 10 LPA
Avg Salary
🚀
New Batch Soon
Limited Seats
DAX + Data Modelling
Core Focus
2
Dashboard Projects
7
Curriculum Modules
100%
Placement Assistance
Course Curriculum

What You'll Learn — Module by Module

A complete Power BI program across 13 classes — from your first report to Power Query (M language), DAX, and cloud deployment. Click any module to expand.

01
Introduction & First Reports
Classes 1–2
+

Understand the Power BI ecosystem, install and configure it, then build and publish your first report.

Power BI Need & Advantages Power View, Query & Pivot History Installation & Cloud Account Architecture & Data Access Report Canvas & Pages GET DATA & Publish Bar / Column Charts
02
Visualizations & Properties
Classes 3–4
+

Every chart and map type, with full control over formatting, filters, and hierarchies.

Import vs Direct Query Visual / Page / Report Filters Custom Tables & Conditional Formatting Chart Types & Field Properties Data Labels & Analytics Lines Map Reports Hierarchies in Visuals
03
Hierarchies & Drilldown
Class 5
+

Multi-level navigation, drill-through, and parameter-driven reports.

Drilldown & Drill Modes Drill-thru with Tree Map / Pie DRILLDOWN / EXPANDTONEXTLEVEL Dependent & Independent Aggregations Report Parameters Synonyms
04
Power Query & M Language
Classes 6–7
+

Clean and reshape data with the Query Editor and the M language.

Query Editor & Applied Steps JSON & Binary Formats Combine — Merge & Append Custom Columns IF..ELSE, Split, Replace Table.Group & Pivot Reports from Web / HTML & QR Codes
05
DAX Expressions — Level 1
Class 8
+

The foundations of DAX — context, entities, and function families.

Purpose & Scope of DAX Row Context & Filter Context Calculated Columns & Measures DAX Data Types & Operators Filter, Aggregation & Logical Functions Time Intelligence Functions
06
DAX Expressions — Level 2
Class 9
+

Advanced measures, ranking, and time-intelligence calculations.

YTD / QTD / MTD TOPN, RANKX, RANK.EQ STDEV & VAR DATESYTD, ENDOFMONTH SAMEPERIOD & PREVIOUSMONTH KPIs with DAX
07
Deployment, Cloud & Insights
Classes 10–13
+

Publish to the cloud, manage refresh and gateways, and share insights across the organisation.

Publish & Cloud Architecture Workspaces, Dashboards & Pins Gateways & Scheduled Refresh PBIX & PBIT Templates Q&A & Cortana Quick Insights Content Packs & Subscriptions
Tools & Technologies

Tools You'll Work With

Hands-on practice with the tools that appear in every Power BI job description.

📊
Power BI Desktop
DAX Studio
🔄
Power Query
Is This Course For You?

Who Should Enroll

Power BI is for anyone who presents data — not just developers.

📋
MIS & Reporting Professionals
Replace static Excel reports with live, interactive dashboards.
📊
Data Analysts
Power BI is in every BI job description — make it a core strength.
💰
Finance & HR Teams
Build dashboards that present KPIs visually to your leadership.
🎓
Fresh Graduates
Power BI on your resume immediately stands out to recruiters.
Career Outcomes

Roles Open to Power BI Graduates

Power BI skills are in demand across IT, banking, e-commerce, and consulting — with strong salary upside.

📊 Power BI Developer
₹5 – 11 LPA
TCS, Wipro, Infosys, HCL, Tech Mahindra, Mphasis
📋 BI Analyst
₹4 – 9 LPA
Genpact, Capgemini, Hexaware, Mastech, Concentrix
📈 Reporting Analyst
₹3.5 – 7 LPA
ICICI Bank, HDFC, Axis Bank, Max Life, Kotak
📊 Data Analyst (BI)
₹4 – 10 LPA
Flipkart, Amazon, Meesho, Nykaa, Urban Company
Our students placed at
Student Stories

Our Students, Placed & Thriving

From Excel users to Power BI professionals — real transformations from this exact course.

RM
Rajat Mishra
Power BI Developer · TCS
★★★★★

The DAX module was the highlight. CALCULATE and time intelligence functions were explained with live business examples — sales YTD, MTD variance. I use these formulas at TCS every single day.

MK
Meena Krishnan
BI Analyst · Genpact
★★★★★

I came from an Excel background and Power BI felt complex at first. But the instructor built everything step by step — by week 3 I was building relational models. Placed at Genpact within a month.

AC
Aditya Chauhan
Reporting Analyst · HDFC Bank
★★★★★

The dashboard design module was brilliant. It wasn't just about dragging visuals — we learnt layout principles, colour usage, and how to present numbers for different audiences. My dashboards look genuinely professional.

SP
Sneha Pillai
Data Analyst · Amazon
★★★★★

The Power BI Service section was an unexpected bonus. Publishing reports, setting scheduled refresh, managing workspaces — things I thought I'd learn on the job. Gave me a head start in my first week at Amazon.

Common Questions

Power BI Training — FAQs

Is Power BI free to use?
Power BI Desktop is completely free. Power BI Service (cloud) has a free tier for personal use and a Pro licence (₹700–800/month) for enterprise sharing. During the course you'll use both.
Do I need SQL or Excel experience before learning Power BI?
Excel basics help, but aren't required. SQL knowledge makes the data modelling section easier but we teach everything from scratch.
Is Power BI enough to get a job?
Power BI combined with Excel and SQL is a strong analyst profile. Many BI Analyst and Reporting roles hire specifically for Power BI skill.
What is DAX and why is it important?
DAX (Data Analysis Expressions) is Power BI's formula language — similar to Excel formulas but more powerful. It's used to create custom metrics, KPIs, and calculations. Most interview questions for Power BI roles involve DAX.
How is Power BI different from Excel dashboards?
Power BI connects live to data sources, handles millions of rows efficiently, and publishes interactive web dashboards. Excel is great for smaller datasets but Power BI is built for enterprise reporting.

Build Power BI Dashboards in 6 Weeks

From data import to published enterprise dashboard — practical, job-focused training. Book your free demo.